


Particle morphology, generally defined as particle size and shape characteristics, are properties...
Particle size controls a vast array of sample properties in many industries. As a result, the analysis of particle size and shape is pivotal in ensuring product quality and performance. Understanding the distribution of particle sizes provides valuable insights into material behavior and performance characteristics. Knowing how these particle size distributions are measured and reported is critical to understanding their impact.
At ImageProVision, we recognize the importance of generating quality, relevant data to each application to provide measurable and inciteful guidance. With regards to the measurement of particle size, there are several techniques available that can accurately measure a distribution of particles in the micron size range. There are very basic techniques, such as sieve analysis, and more advanced techniques such as laser diffraction, and microscopic particle image analysis, to name a few. The challenge associated with these comparative techniques is that they each measure different physical properties of the particles, leading to differences in the resulting distributions.
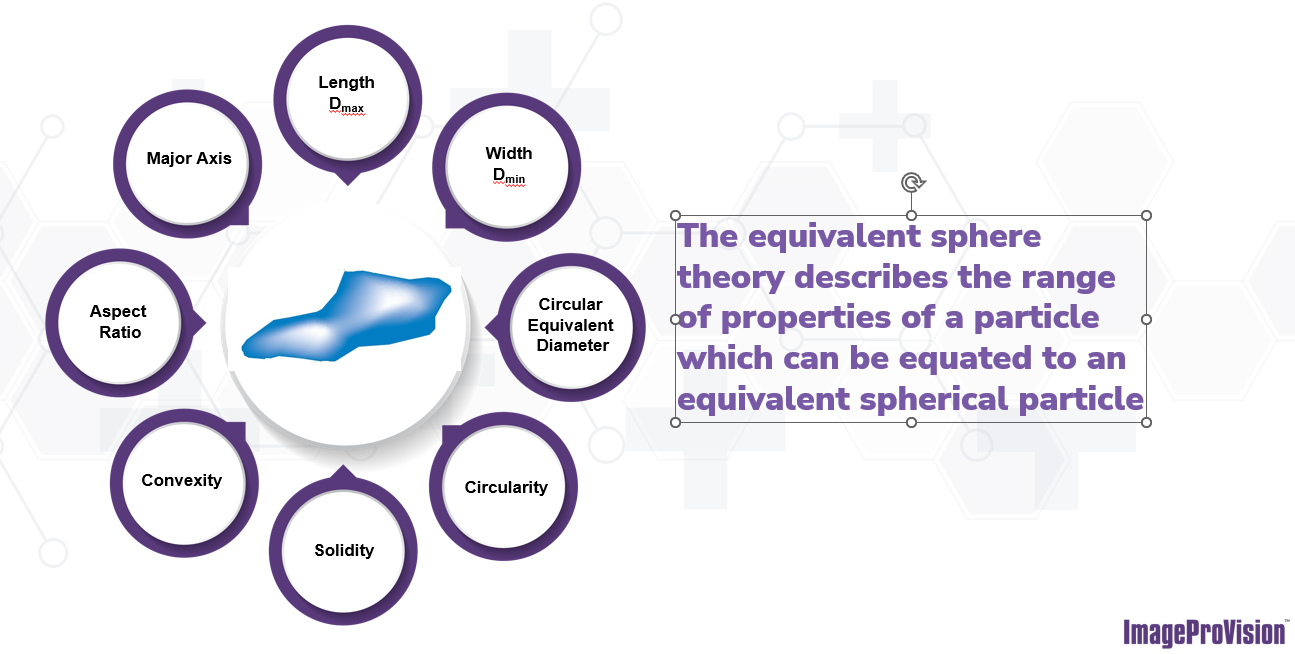
The difference between these advanced techniques is the resultant distributions, one being volumetric or based on a particle estimated spherical diameter, the other being number or based on the physical number of particles present in the sample. For Laser diffraction the analysis method provides a volumetric size distribution, reporting results as spheres of equivalent volume. This is known as equivalent sphere theory, a theory that describes all of the different properties of particles that can be related to a particle of equivalent sphere, as seen in the figure below. In contrast, when using a microscope to measure the size of a particle the measurement is performed on a particle-by-particle basis, this type of measurement is considered a number based distribution. The primary difference between these two results is the contribution each particle makes to the overall distribution, in volume, there is a cubic relationship between the particles present and their contribution to the histogram produces, as compared to number distributions where there is a linear relationship the particles and their contribution to the resultant histogram, this creates quite a disparity between the two resultant histograms that often needs further explanation.
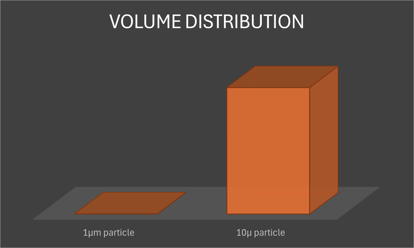
Let's consider an illustrative example: a sample comprising two spherical particles one 1μm and one 10μm in diameter. For the resultant histograms, the number distribution would show two peaks, each contributing the same number of particles, so there for the peaks would be of the same magnitude. In the volumetric distribution, whilst still containing two peaks, the magnitude of the peaks would be considerably different, because the volume of the 10μm particle is significantly larger than the 1μm particle. Therefore, the peak magnitudes would be considerably biased towards the 10μm particle as seen in the figures below.

While volume distributions are an entirely valid way of representing the data, they do highlight a disproportionate influence of larger particles. Consequently, volume distributions offer valuable insights into the presence and characteristics of larger particles and aggregates, crucial for applications such as content uniformity control and the development of topical dosage forms.
ImageProVision leverages fundamental technologies in image analysis to derive accurate number distributions, essential for detecting subtle size differences between samples. These differences, often imperceptible in volume distributions, can significantly impact product performance, especially in processes like granulation. Furthermore, number distributions play a vital role in applications where fine particles significantly influence material behavior, such as moisture sorption, solubility, and dissolution rates. This difference is primarily due to the contributions fine particles have to a samples surface area. By focusing on the number of particles within specific size ranges, we gain valuable insights into product characteristics that may otherwise go unnoticed.
In summary, particle size analysis, whether through volume or number distributions, serves as a cornerstone in ensuring product quality, performance, and consistency across various industrial applications. At our company, we are committed to leveraging the latest advancements in particle size measurement to drive innovation, enhance product quality, and meet the evolving needs of our customers.